Who Cares About Social Care?
Google news searches for "social care" have never been higher than they were in 2011. Should we be worried?

In the late 1990s and early 2000s, the discussion around climate change became dominated by something known as the ‘hockey stick graph’. Bear with me here…
The hockey stick graph was a chart of temperature data stretching roughly from the date of the Norman conquest to the year 2000. Some of its datasets covered the whole globe; some just the northern hemisphere. Taken together, they delivered an alarming message with a distinctive shape: global temperatures had been rapidly rising since the industrial revolution, to such an extent that the sudden jump made the end of the graph look like the blade of a hockey stick.

Credit: Wikimedia Commons
Although it was the dry output of some pretty arid scientific papers – and despite the fact that it still contained plenty of jargon and required significant knowledge to understand properly – it was perfect. It was exactly what the scientists needed to wave in the face of policy-makers and get them to sit up and listen. It was a clear, unambiguous warning.
Here’s home care’s version of the hockey stick graph. It’s based on Google Trends data for the number of searches for the term ‘home care’ (in which Google also includes ‘care home’) within the Google News portal. It doesn’t (or shouldn’t) include searches for people simply looking for home care providers, and as such should be a crude gauge of interest in the sector, rather than simply its services. We’ve done our best to annotate the graph with the likely causes of its peaks.
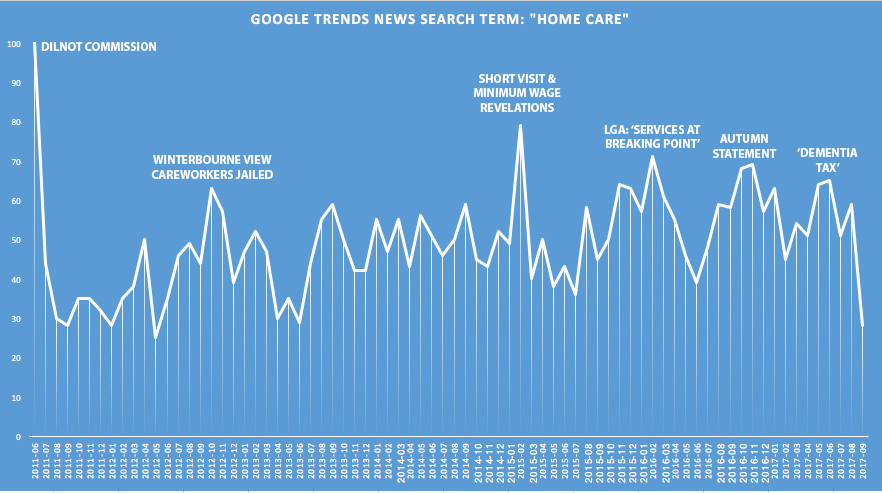
First off, you’ll notice it’s the inverse of the climate scientists’ hockey stick graph: here, the big spike is at the beginning of the graph. It corresponds with the publication of the report from the Commission on Funding of Care and Support, otherwise known as the Dilnot Review. It represents an enormous surge of interest in the topic, and, as you can see, far outstrips anything other home care topic that has been searched for on Google News since. It was more important even the ‘dementia tax’ fiasco of the 2017 General Election.
In fact, although the trend of the graph is roughly in the upwards direction, the average of all the news searches that came after Dilnot comes in at just 50% of the interest in the 2011 review.
In other words, interest in the sector during the last half decade has never come close to surpassing that in the Dilnot review, whose published recommendations have been prevaricated over ever since. It’s a depressing thought.
But, just as with the climate change hockey stick graph, this one is controversial too. At the time, scientists who were sceptical about man-made global warming argued that simply looking at the last 1000 years didn’t give a realistic picture of the variability of the climate system. And some of them continue to argue about the statistical methods employed to this day, despite the fact that the general warming trend has been independently corroborated.
With our graph, things start to become interesting if you also look at Google Trends data for the news search term ‘social care’. You might expect a similar profile to the ‘home care’ graph, but it actually looks quite different.
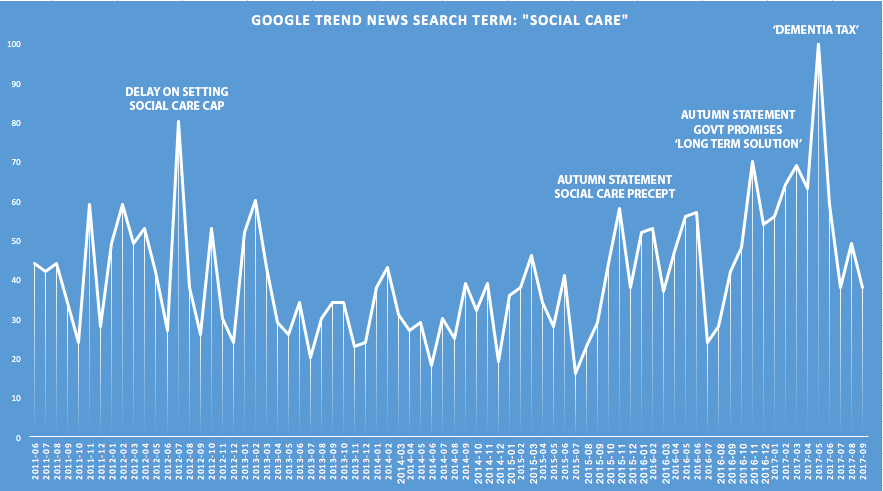
Here, we see almost no spike for Dilnot (perhaps because of how people use Google, typing in specific search terms to scan the news for what will affect them personally), but a very large spike for the ‘dementia tax’ General Election scandal of 2017, and smaller spikes for the spending review of 2015. The general trend, though, is more noticeable upwards.
So, in an attempt to get a better gauge of interest in the sector, let’s average the data from both graphs.
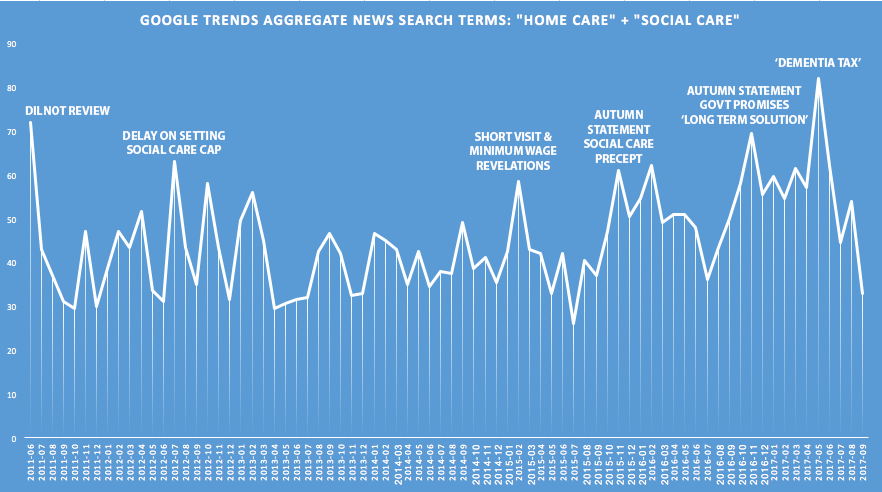
This shows something much closer to what we would expect: a big spike for Dilnot, spikes for the spending reviews, and a spike for the dementia tax scandal. But what’s really important is what happens when we add a trendline...
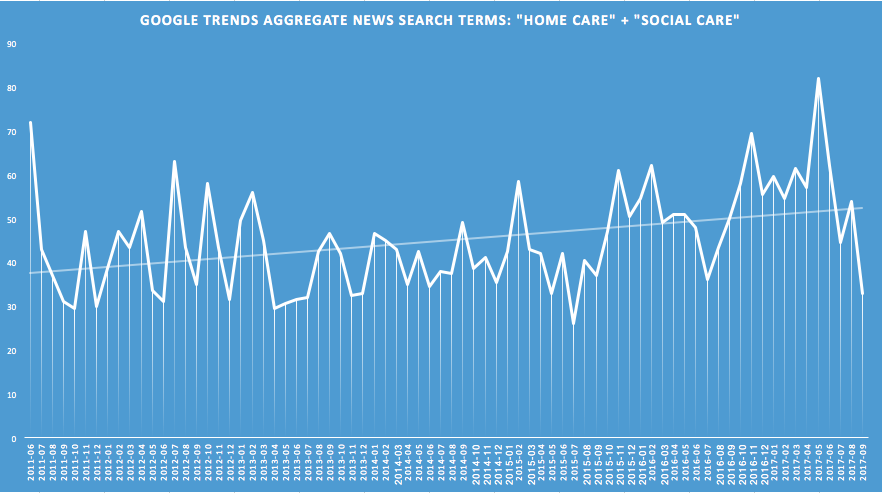
...it’s an encouraging one. It shows that, despite the massive skew of the Dilnot review and the furore of the Theresa May’s spending cap U-turn, the general level of interest in social care as a whole is increasing. The trendline helps us to see past those spikes and gives us a little more sense of the wider dialogue.
People are talking about social care; people are listening. It’s time for everyone involved in the sector to make their voices heard.

